
Figure 3.
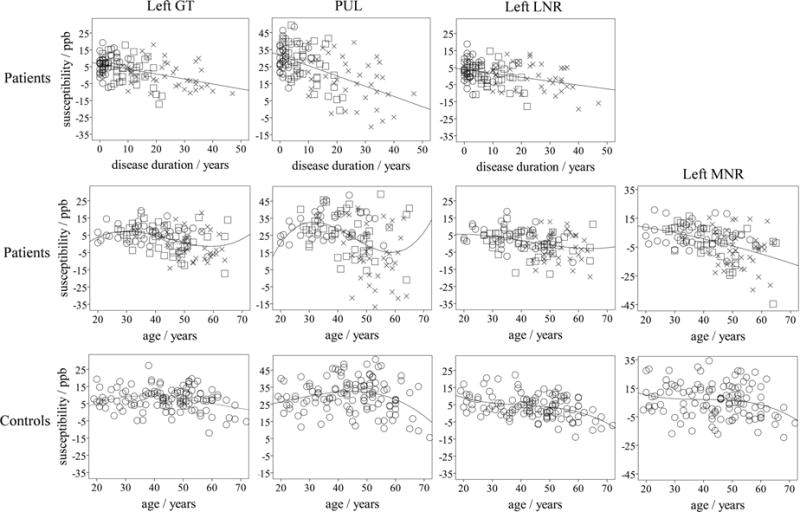
Top and middle row: Scatter plots illustrating univariate associations of susceptibility for regions that were significant in the multivariate analysis (top row and middle row for patients) and, for illustrative purposes, associations with age for the same regions (middle row). The shapes of the markers indicate the clinical phenotypes: circle – CIS; square – RRMS; cross - SPMS. In the top row, linear regression curves are used, whereas in the middle row cubic curves were used, except for the MNR, where we used a quadratic fit. Bottom row: Scatter plots of the susceptibilities in corresponding regions of NCs over age. The regression line for the left GT was determined by fitting a + b · (0.3 mg/100g · age −5.82·10−3 mg/100g · age2 + 3.15·10−5 mg/100g · age3) to the susceptibility values (Levenberg-Marquardt), which relies on the known iron aging-trajectory in the GT (see Figure S.6 in the Supplementary Material). The fitted coefficients were a = (−15.3±6.9) ppb and b = (5.22±1.58) ppb·100g/mg. For the other NC plots, we used a cubic regression (PUL: R2=0.13, ANOVA p=0.0011, 22.0ppb – 7.18·10−3 ppb/a · age + 1.62·10−2 ppb/a2 · age2 − 2.41·10−4 ppb/a3 · age3; MNR: R2=0.05, p=0.11; LNR: R2=0.22, p<0.001, 20.3ppb – 8.36·10−1 ppb/a · age + 1.77·10−2 ppb/a2 · age2 − 1.48·10−4 ppb/a3 · age3). For improved visualization, all ordinates, except that of the MNR, cover a susceptibility interval of 65ppb (all data points are visible).