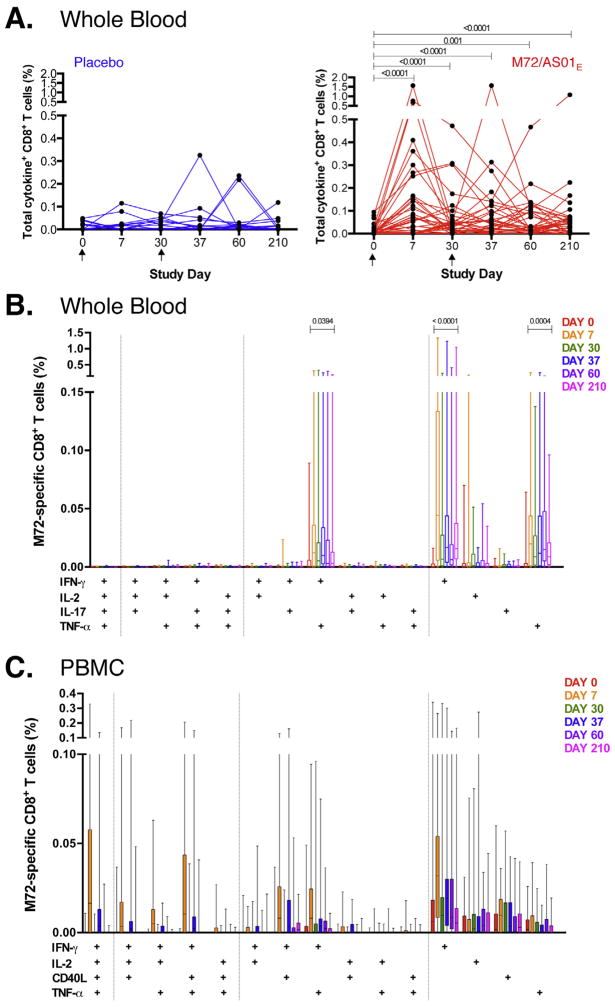
Fig. 2.
M72/AS01E induces a sustained CD8 T cell response. Longitudinal CD8 T cell responses to pooled M72 peptides in whole blood (A and B) and cryopreserved PBMC (C) from individual participants. (A) Total cytokine responses were calculated as the frequencies of CD8 T cells expressing any of IFN-γ, IL-2, TNF-α and/or IL-17. Each line represents a different individual in either the M72/AS01E vaccinated (n = 40, red) or placebo-vaccinated group (n = 19, blue). Arrows represent the time of vaccination. Results are shown after background subtraction of frequencies of cytokine-expressing CD8 T cells in the unstimulated negative control sample. Wilcoxon matched pairs signed rank test was used to compare frequency of M72-specific total cytokine response between two time points. Wilcoxon matched pairs signed rank test p values are shown after adjustment for multiple comparisons, compared to pre-vaccination time point. Friedman test was used to calculate significant differences across time. (B) Frequencies of M72-specific CD8 T cells expressing IFN-γ, IL-2, TNF-α and IL-17 measured by ICS assay after stimulation of whole blood with M72 peptide pools. For each plot, only M72/AS01E vaccinated participants are shown. The median, interquartile range and range are shown. Durability of response of each CD8 T cell subset was measured by Wilcoxon matched-pairs signed rank test comparing Day 210 to pre-vaccination responses; only values <0.05 are shown. (C) Frequencies of CD8 T cells expressing IL-2, TNF-α, IFN-γ and CD40L in response to M72 peptide pool stimulation measured in cryopreserved PBMC by ICS. For B and C, only the M72/AS01E vaccinated participants are shown. Results are shown after background subtraction of cytokine production in the unstimulated control. No subsets showed any significance in expression between Day 0 and Day 210 in the PBMC assay when performing Wilcoxon matched pairs signed rank test. (For interpretation of the references to color in this figure legend, the reader is referred to the web version of this article.)

