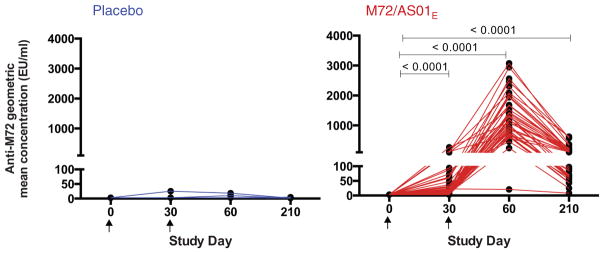
Fig. 4.
M72/AS01E induces an antibody response. Geometric mean concentrations (GMC) of anti-M72 IgG antibodies measured by ELISA in serially diluted serum from placebo (blue) and M72-vaccinated participants (red). The Friedman test was used to compare all time points, and Wilcoxon matched pairs signed rank test used to compare each time point to Day 0.

