
Fig. 1.
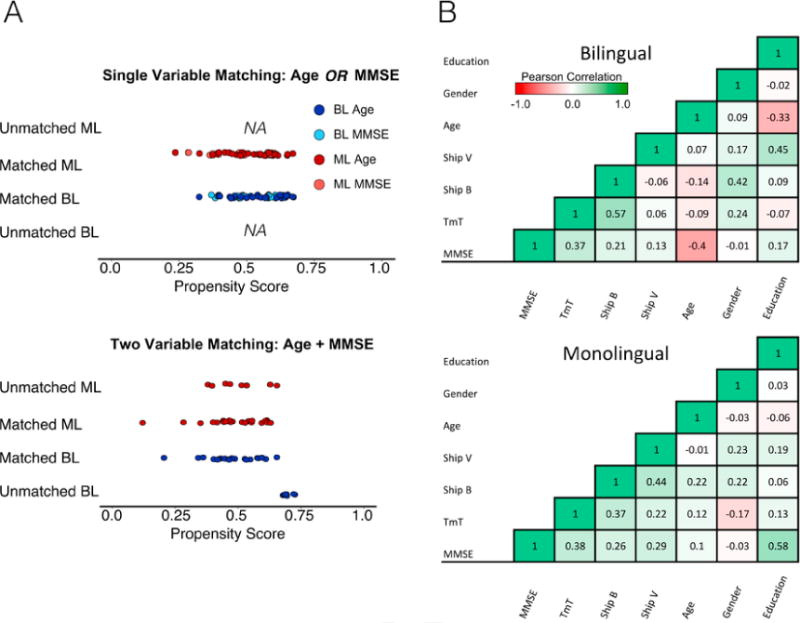
Effects of propensity score matching on single versus multiple variables. The left side of the Figure, Panel A, shows the effect of matching on either MMSE or age. The final propensity score analysis shows the effects of including both scores together. Only when multiple variables are entered into the matching procedure do participants start being removed. This effect is driven by the interactions between variables. Panel B shows the bivariate relationships between variables by group.