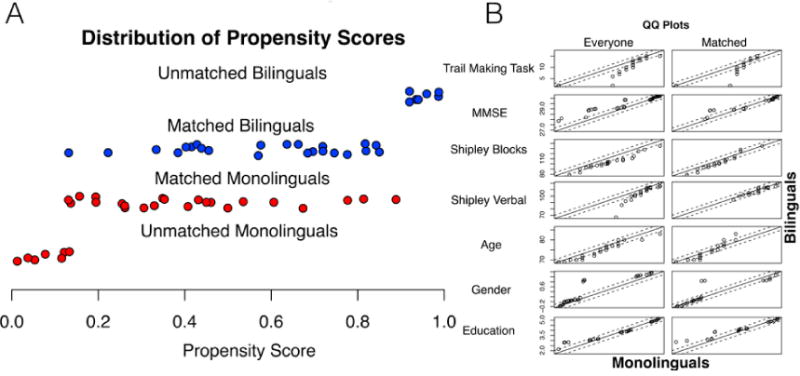
Fig. 2.

Distribution of Propensity Scores. Groups were matched using 7 measures (Trail-making [letter-number], MMSE, Shipley Verbal, Shipley Blocks, age, gender, and education) and k-means-nearest neighbors using the MatchIt package in R. Panel A shows the range of propensity scores, Panel B shows quantile-quantile plots for each of the measures in the unmatched and matched samples. Scores by quantile in the monolingual group were used to predict scores by quantile in the bilingual group. Deflections above or below the line correspond to systematic group differences, and a perfect relationship between the groups (i.e., no difference on this measure) is reflected by the degree to which the measure follows the line of union.
