
Figure A.1. Variance explained by imaging site (R2).
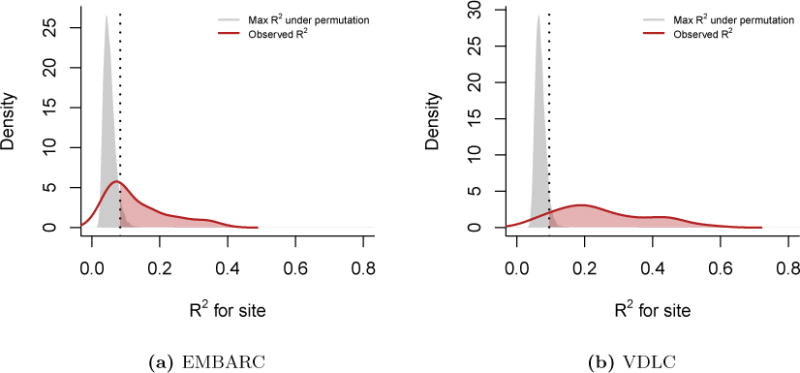
For each feature, we calculated the coefficient of determination R2 between cortical thickness and imaging site. We present the densities of R2 (red lines) for the (a) EMBARC study and the (b) VDLC study. To obtain a measure of significance and to correct for multiple comparisons, we performed a one-step max R2 procedure. Briefly, we permuted the site labels B = 10, 000 times, recalculated the R2 values and retained the maximum R2 value at each permeation. The grey densities represent the distribution of the maximum R2’s. The vertical dashed line indicates the 95% quantile of the maximum R2 distribution. The features above that threshold are significant at the α = 0.05 level (shaded red area). Most features remained significant after adjustment.