
Figure 2. Distribution of covariates in the EMBARC study.
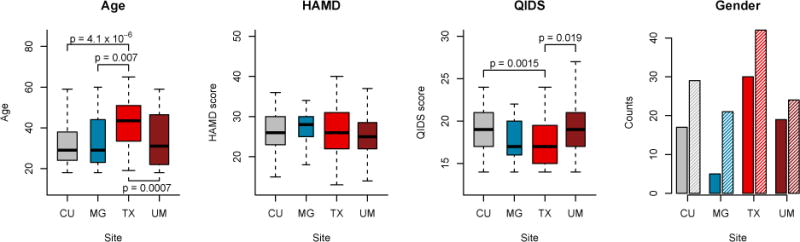
Distributions of age, gender, HAMD score and QIDS scores across sites for the EMBARC study. The width of the boxplots is proportional to the number of subjects scanned at each site. The full and shaded bars in the gender barplots represent males and females respectively. HAMD: Hamilton Depression Rating Scale; QIDS: Quick Inventory for Depression Symptomatology. p-values indicate the significant differences in means between the centers. Gender ratios were not significantly different between sites.