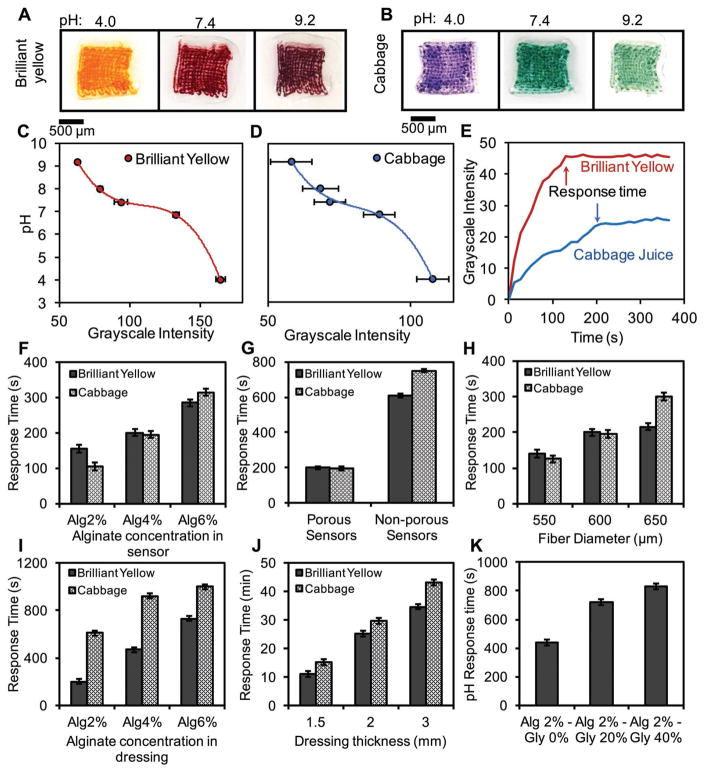
Figure 3.
Quantitative colorimetric analysis of pH using porous sensors. Colorimetric detection of pH using A) Brilliant Yellow and B) cabbage juice. Standard calibration curves for sensors made from C) Brilliant Yellow and D) cabbage juice. E) Typical response times of porous sensors. Effect of F) alginate concentration in the sensors, G) sensor porosity, H) diameter of sensor fibers, I) alginate concentration in the dressing body, J) thickness of the dressing, and K) glycerol content and on the response time. Error bars represent the SD (n = 3).

