Figure 4.

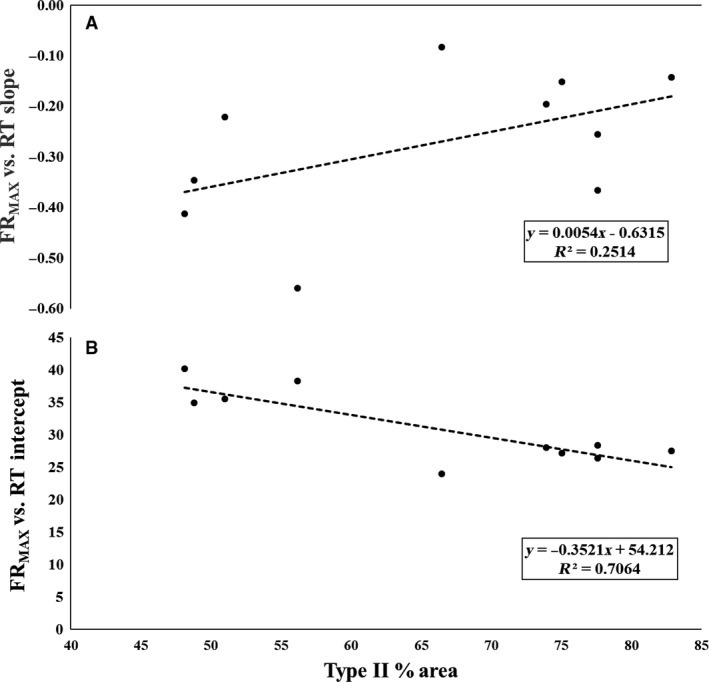
The plotted relationships between type II fiber area and the maximal firing rate (FRMAX) versus (A) Recruitment Threshold (RT) slopes and (B) RT intercepts.

The plotted relationships between type II fiber area and the maximal firing rate (FRMAX) versus (A) Recruitment Threshold (RT) slopes and (B) RT intercepts.