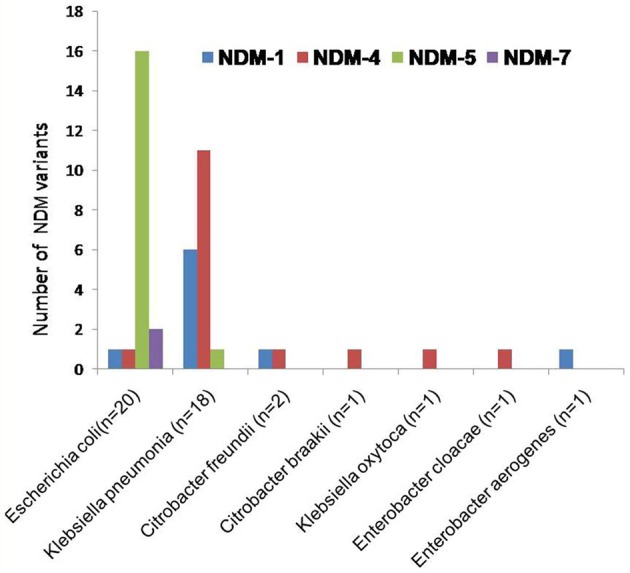
Figure 3.

The clustered bar graph presents the number of NDM variants (each is represented by its own bar) distributed among NDM-producing enterobacteriaceae collected from NICU. The horizontal axis represents the NDM-producing enterobacteriaceae while the vertical axis represents the number of NDM variants.
