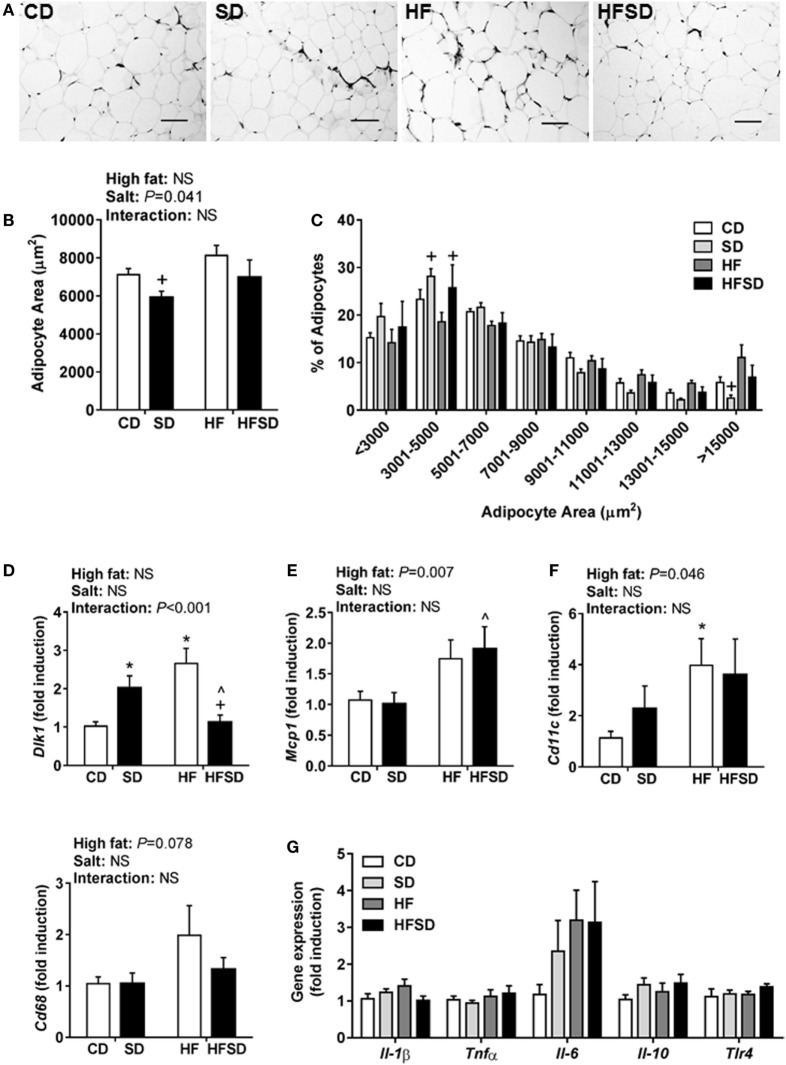
Figure 2.
Adipocyte morphology and adipogenic and inflammatory markers in retroperitoneal adipose tissue of adult male offspring. Fixed retroperitoneal adipose tissue was sectioned and stained with hematoxylin and eosin (n = 7/group). Four representative images were blindly analyzed per animal in Image J 1.48v. (A) Representative images from each group; scale bar represents 100 µm. (B) Average adipocyte area and (C) adipocyte area according to distribution in size. Retroperitoneal adipose tissue gene expression of (D) Dlk1; (E) Mcp1; (F) Cd11c; and (G) Il-1β; Tnfα; Il-6; Il-10; and Tlr4 (n = 7/group). Data were analyzed by two-way analysis of variance, with post hoc Holm–Sidak tests for multiple comparisons. Data are expressed as mean ± SEM, where *P < 0.05 vs CD, ^P < 0.05 vs SD, and +P < 0.05 vs HF.

