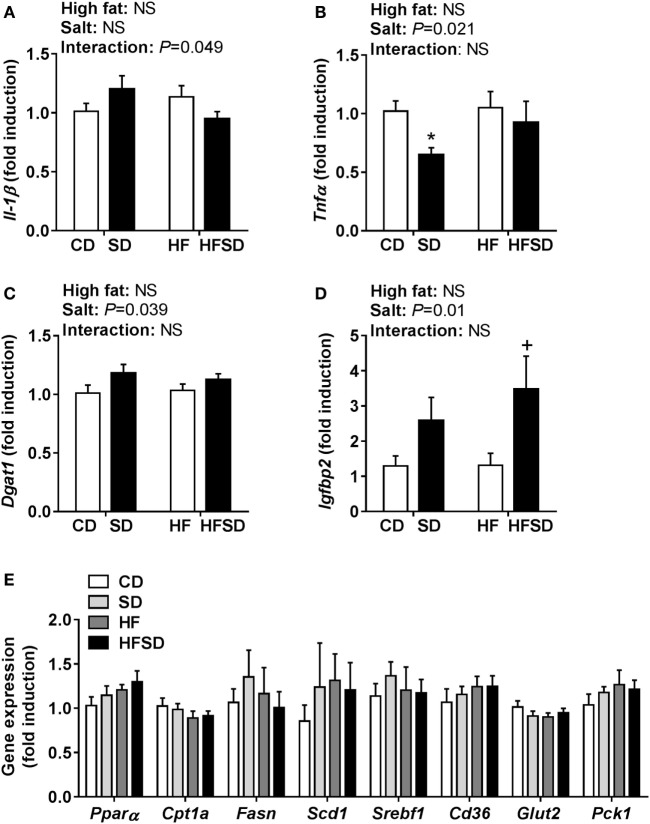
Figure 4.
Hepatic gene expression of inflammatory cytokines and markers associated with insulin resistance. (A) Il-1β; (B) Tnfα; (C) Dgat1; (D) Igfbp2; and (E) Pparα; Cpt1a; Fasn; Scd1; Srebf1; Cd36; Glut2; and Pck1 gene expression determined by RT-qPCR (n = 7/group). Data were analyzed by two-way analysis of variance, with post hoc Holm–Sidak tests for multiple comparisons. Data are expressed as mean ± SEM, where *P < 0.05 vs CD and +P < 0.05 vs HF.

