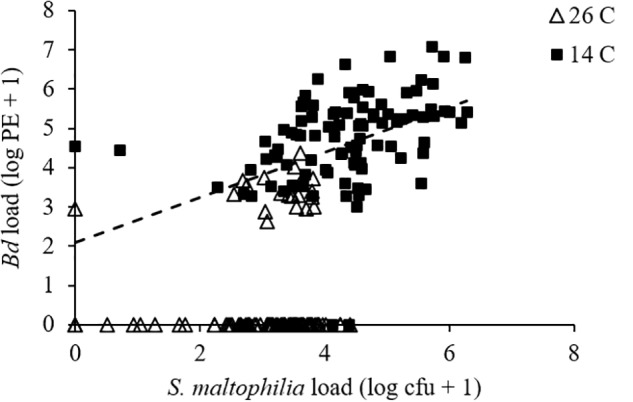
FIGURE 2.

Relationship between Bd load, measured as log10 of PEs and S. maltophilia load, measured as log10 of colony forming units (cfus) for Bd-exposed frogs. Line is the least-squares line of best fit (y = 0.5722x + 2.0977; R2 = 0.171) for frogs at 14°C. The relationship was non-significant at 26°C.
