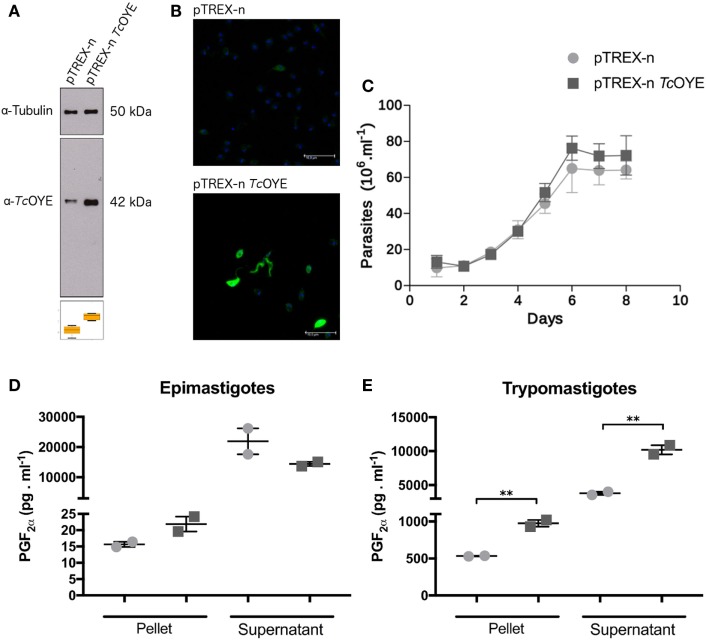
Figure 4.
TcOYE overexpressing parasites presents higher levels of PGF2α than control parasites. (A) Western blot analysis of total protein extracts from epimastigotes transfected with pTREX-n (empty vector) and pTREX-n TcOYE (includes complete TcOYE coding sequence) using rabbit α-TcOYE polyclonal antibodies. The relative expression was estimated by image densitometry analysis normalized by tubulin expression. TcOYE overexpression in epimastigotes was 3.4 times more than controls. (B) Trypomastigotes and extracellular amastigotes overexpression analyzed by IIF using rabbit α-TcOYE polyclonal antibodies. (C) Growth curves of TcOYE overexpressing parasites (pTREX-n TcOYE) vs. empty vector containing parasites (pTREX-n). (D,E) Determination of PGF2α in epimastigotes and trypomastigotes. These results correspond to concentration values of PGF2α from two replicates. Asterisks represent statistical significance (two tailed Student’s t-test).

