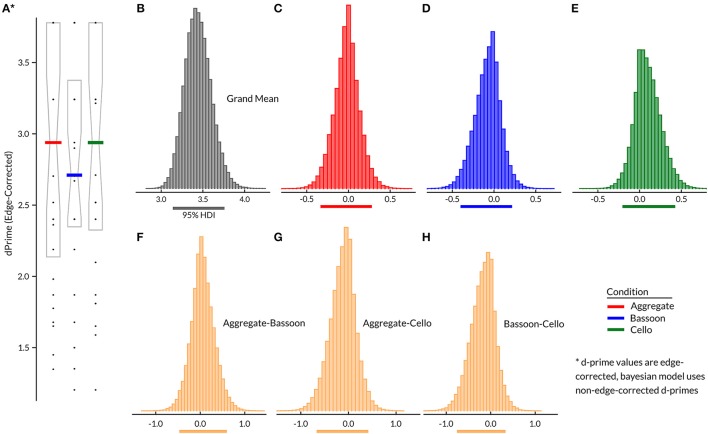
Figure 2.
Experiment 1 group results (N = 29) for edge corrected d-prime per condition (A), with median (horizontal bar) and 25th–75th percentile. Bayesian hierarchical model (B–H), with group grand mean (B), attention effects (C–E), and contrasts between attention conditions (F–H). Horizontal lines below (B–H) indicate 95% HDI.

