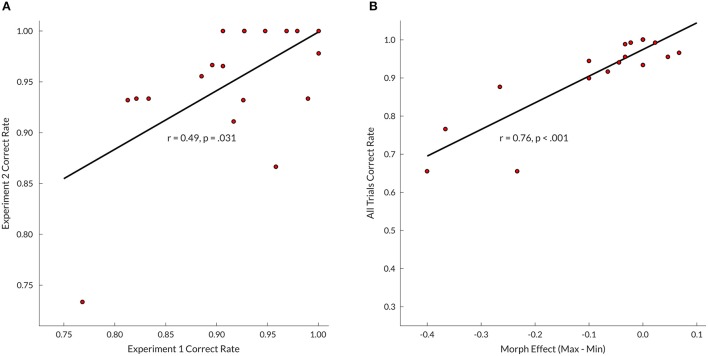
Figure 5.
(A) Experiments 1 and 2 (maximum timbre distance trials only) correlation between correct rates across trials; for Experiment 1 only those subjects who completed both experiments were included (N = 19). (B) Correlation between Experiment 2 subject morph effects and correct rates across all trials. Morph effect calculated by subtracting correct rates over all minimum morphing distance trials from correct rates of all maximum distance trials.

