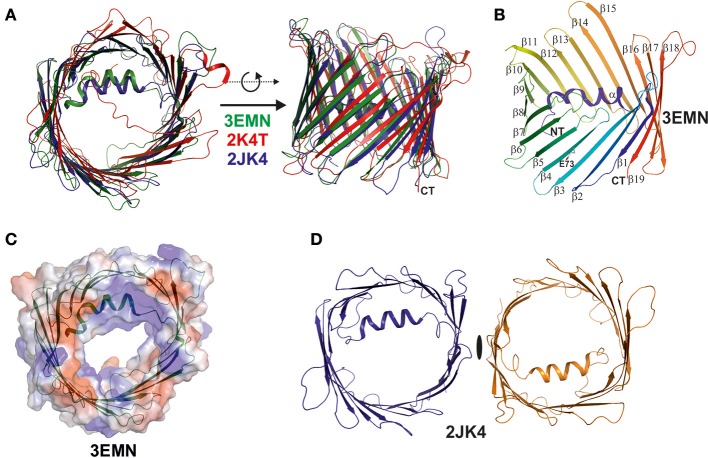
Figure 2.
Superposition of the three VDAC structures published simultaneously in 2008. The three structures were determined by X-ray, NMR spectroscopy, and a combination of both methods (Bayrhuber et al., 2008; Hiller et al., 2008; Ujwal et al., 2008). (A) Here, we superimposed the three structures and displayed them in ribbon representation to highlight their analogies and differences. The X-ray structure (3EMN) is shown in green, the NMR structure (2K4T) is shown in red, while the hybrid structure (2JK4) is displayed in blue. The structures are viewed from two different perspectives related by a 90° rotation around the x-axis. The major difference between the structures is the location and secondary structure assigned to the N-terminal helix in the NMR structure. (B) Structure of mVDAC displaying the fold of the VDAC superfamily proteins. The structure is color coded from the N- (blue) to the C-terminus (red) and secondary structure elements are annotated (alpha, beta1-beta19). (C) A primary function of VDAC in the MOM is to translocate nucleotides and the surface representation of VDAC color coded in surface charge potentials is provided. This representation shows the channel pore together with the electrostatic surface potential which is primarily positive around the channel eyelet. (D) The crystal structure of 2JK4 showed a potential VDAC dimer in the crystal lattice and although the dimer contacts are rather weak, the interface formed by strands beta1 and beta19 appears to be biologically important. All figures were prepared using PYMOL (www.pymol.org).

