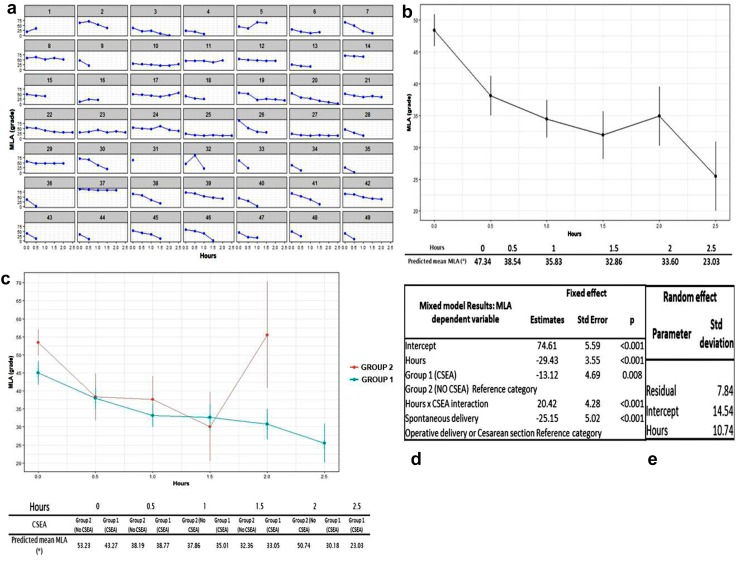
Fig. 6.
a HSD performance of individual patients over time. Group 1: patients No. 1–29; Group 2: patients no 30–49; b overall average performance of HSD (Group 1 + 2) in relation with time; c Average trend of HSD values divided by groups; d mixed model results for HSD: fixed effects; e mixed model results for HSD: random effects

