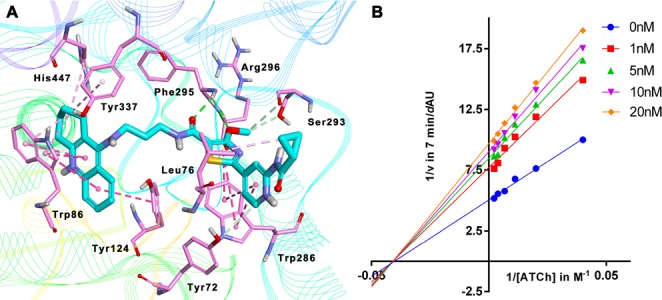
Figure 2.

Binding mode prediction of 2f with hAChE (PDB id: 4EY7). (A) Compound 2f was shown in stick mode colored in green. Key residues were labeled as thin stick mode colored in orange. Intermolecular interactions were shown with different colored dotted lines: light green, hydrophobic contact; yellow, π-cation; purple, π-alkyl contact. (B) Lineweaver–Burk plots resulting from subvelocity curves of AChE activity with different substrate concentrations (25–450 μM) in the absence and presence of 1, 5, 10, and 20 nM 2f.
