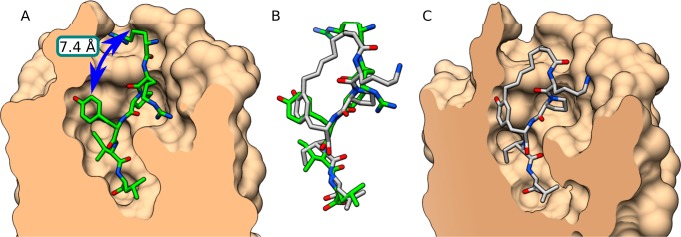
Figure 4.
Comparison of the crystallized NT (8–13) conformation with 10. (A) NTS1 crystal. Blue arrow indicates available space between Tyr11 and Arg8. (B) Superimposition of NT (8–13) from the crystal and macrocycle 10 (docked). (C) Macrocycle 10 docked into a homology model of human NTS1 based on the crystal. Molecular graphics were performed with the UCSF Chimera package.43

