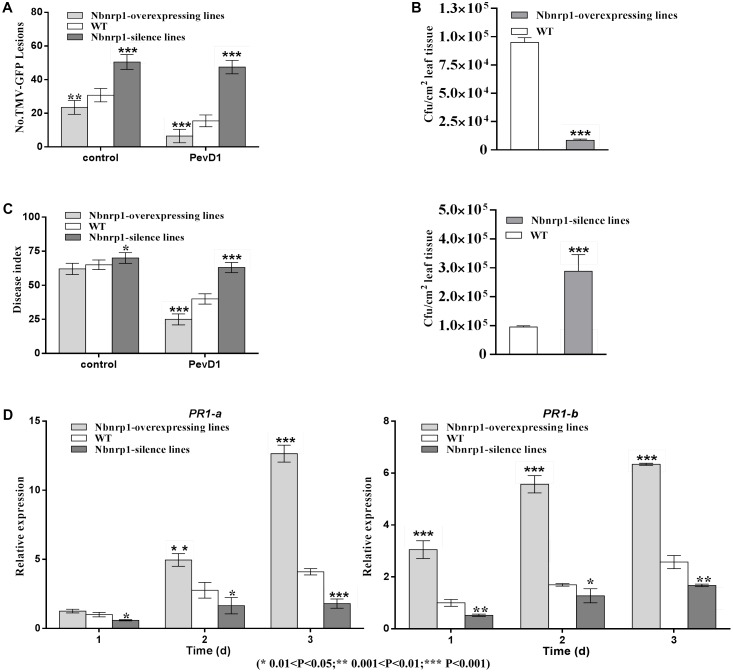
FIGURE 6.
(A) The number of GFP puncta in wild-type plants was compared with that in Nbnrp1-overexpressing lines and the Nbnrp1-silence lines. The data showed significantly difference TMV-GFP infection, being observed at 3 dpi. The results are mean values (±SD) from three independent experiments. (B) The number of CFU/cm2 in wild-type plants was compared with two mutants and displayed significantly difference infection by P.s. pv. tabaci, being observed at 3 dpi. (C) The disease caused by V. dahliae strains as measured by the disease index. Asterisks indicate a significant difference from the WT by Student’s t-test. (∗0.01 < P < 0.05, ∗∗0.001 < P < 0.01, ∗∗∗P < 0.001). (D) Expression levels of the defense-related genes PR1-a and PR1-b. N. benthamiana leaves were infiltrated with PevD1. At the indicated times, the relative expression levels of PR1-a and PR1-b genes were measured via qPCR. The samples were normalized against EF-1a. Expression levels are represented as the fold change in relation to the wild-type plants. The results are mean values (±SD) from three independent experiments. The statistical analyses were performed using Student’s t-test (∗0.01 < P < 0.05, ∗∗0.001 < P < 0.01, ∗∗∗P < 0.001).

