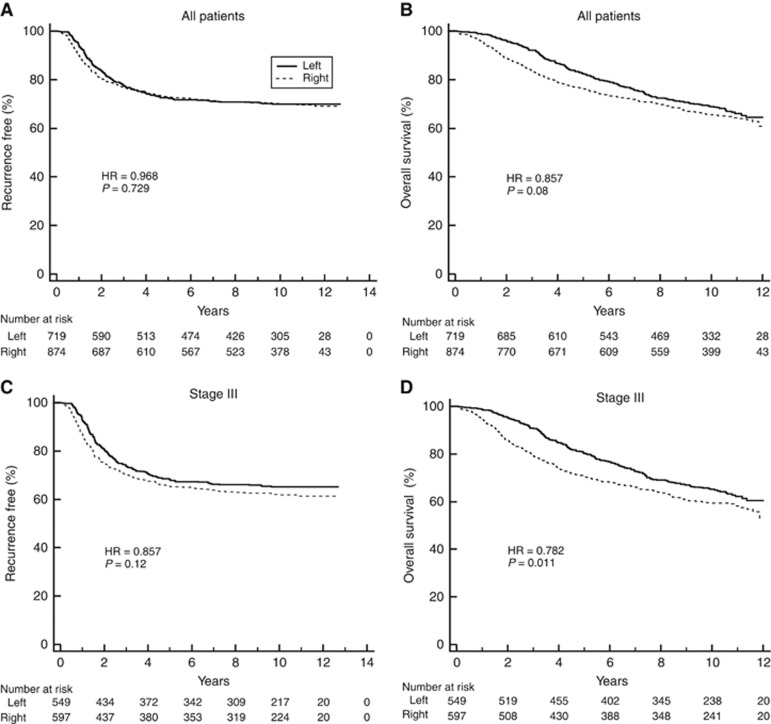
Figure 2.
Kaplan-Meier plots for NSABP/NRG Oncology C-07 patients stratified by sidedness (left vs right) in: (A) all patients based on RFS, (B) all patients based on OS, (C) stage III patients based on RFS, and (D) stage III patients based on OS. The number of patients at risk is shown below the graph.

