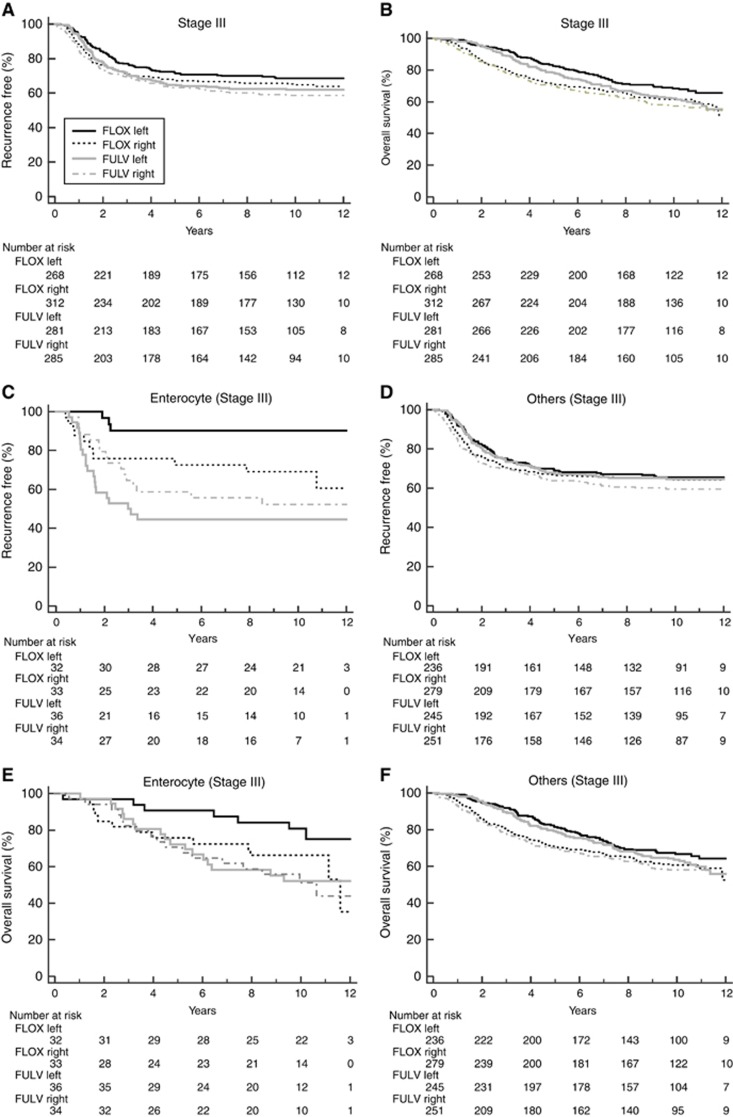
Figure 3.
Kaplan-Meier plots for NSABP/NRG Oncology C-07 patients stratified by sidedness (left vs right) and treatment (5-fluorouracil (5-FU) plus leucovorin (LV) vs 5-FU+LV and oxaliplatin (FLOX)) in: (A) stage III patients based on RFS, (B) stage III patients based on OS, (C) stage III enterocyte-subtype patients based on RFS, (D) stage III other-subtype patients based on RFS, (E) stage III enterocyte-subtype patients based on OS, and (F) stage III other-subtype patients based on OS. The number of patients at risk is shown below the graph.

