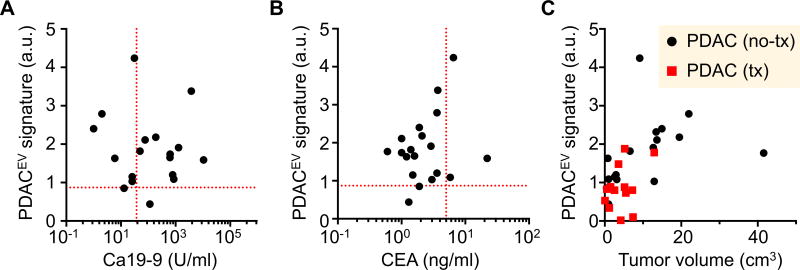
Fig. 6. Comparison of EV analyses with conventional clinical metrics.
The PDACEV signature values are correlated to serum biomarkers (CA 19-9, A and CEA, B) on patients with PDAC and the tumor diameter (C). The dashed red lines indicate the threshold values to be positive (CA 19-9, 37 U/ml; CEA, 5 ng/ml; PDACEV signature, 0.87). a.u., arbitrary unit.

