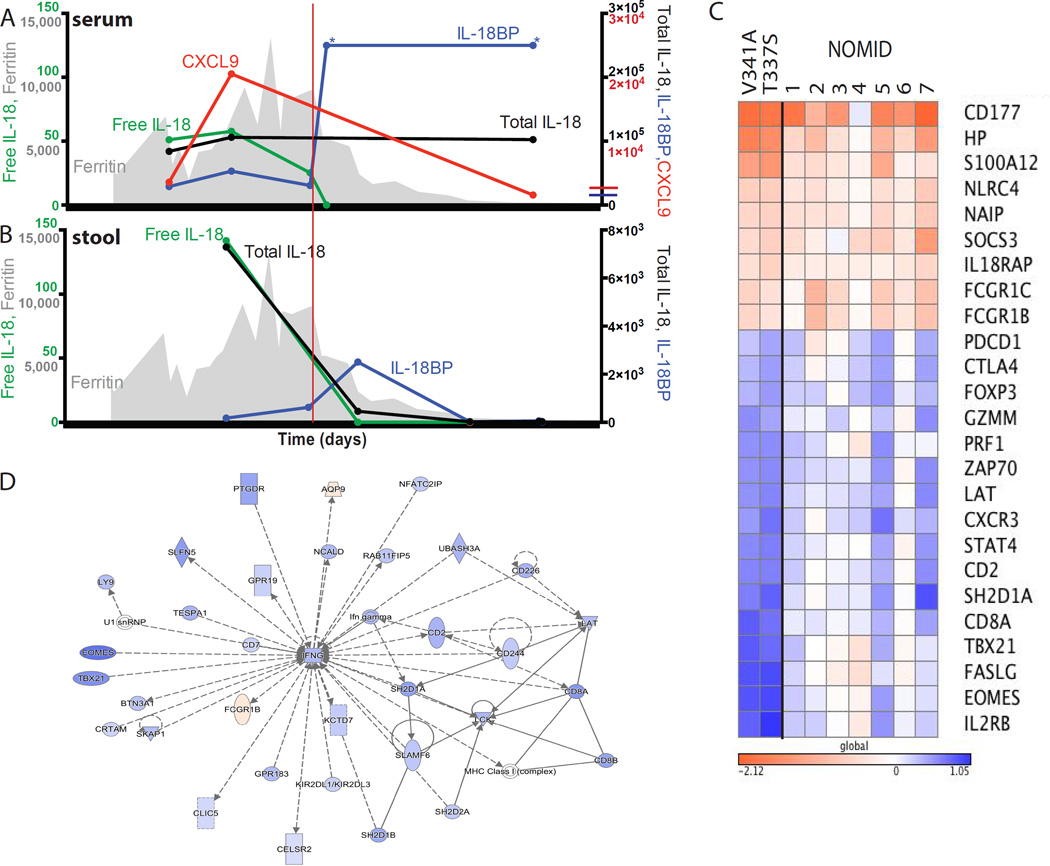
Fig 2. Serum, Stool, and Transcriptional Analyses.
Serum (A) and stool (B) cytokines (in pg/mL) and serum ferritin (gray, ng/mL). Upper limit of healthy controls, if visible, crosses y-axis. (C) and (D) Whole blood RNA-seq comparing flare versus post-treatment in this patient (V341A), another NLRC4-MAS patient (T337S)(2), and seven NOMID patients. Log10 fold-change for genes higher (red) or lower (blue) during flare in both NLRC4-MAS patients. See also Supplemental Table 1. (D) Most-enriched transcriptional network generated by the differentially-expressed gene list. *Upper Limit of detection.

