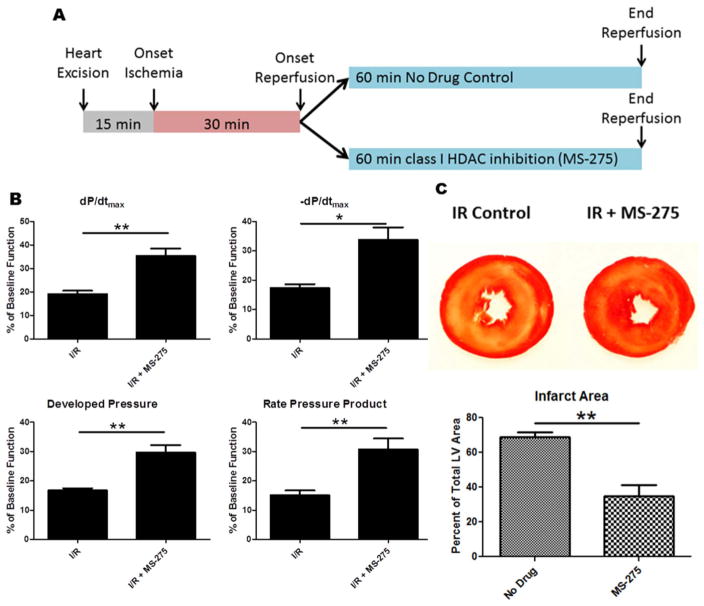
Fig. 1.
Experimental design, recovery of ventricular function and TTC staining following class I HDAC inhibition at reperfusion. (A) Experimental design for I/R procedures. (B) Graphs represent measurements of left ventricular function after 30 min of ischemia and 60 min of reperfusion. dP/dtmax indicates the rate of pressure development, −dP/dtmax indicates the rate of pressure relaxation, Developed Pressure was calculated as the difference between the systolic and diastolic pressures, Rate Pressure Product was calculated as the developed pressure multiplied by the heart rate. Measurements were taken at the end of reperfusion and represented as a percentage of baseline pre-ischemic function. (C) TTC staining for infarct area at the end of reperfusion; yellow/white region indicates area of infarction. Infarct areas were measured using imageJ software. All data are represented as mean ± S.D. N = 4, t-test *p, 0.05. (For interpretation of the references to color in this figure legend, the reader is referred to the web version of this article.)

