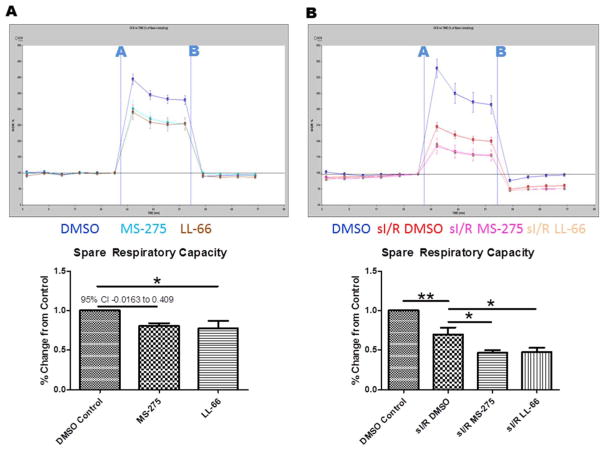
Fig. 4.
Effect of class I HDAC inhibition on OCR and ROS. (A) Measurements of oxygen consumption rate (OCR) in isolated cardiac myocytes. FCCP was injected at point A and antimycin D/rotenone injected at point B. (B) Measurements of OCR in isolated myocytes subjected to normoxia (blue) or chemical hypoxia reoxygenation (red) and reperfused with DMSO (red), MS-275 (pink), or LL-66 (peach). For (A) and (B), top panels are representative, bottom panels are the uncoupled rate as a percentage of baeline rate over 4 runs. Representative seahorse data are represented mean ± SEM, Bar graphs are represented mean ± S.D. For all experiments, N = 4, one way ANOVA with Dunnet post test *p < 0.05, **p < 0.01. (For interpretation of the references to color in this figure legend, the reader is referred to the web version of this article.)

