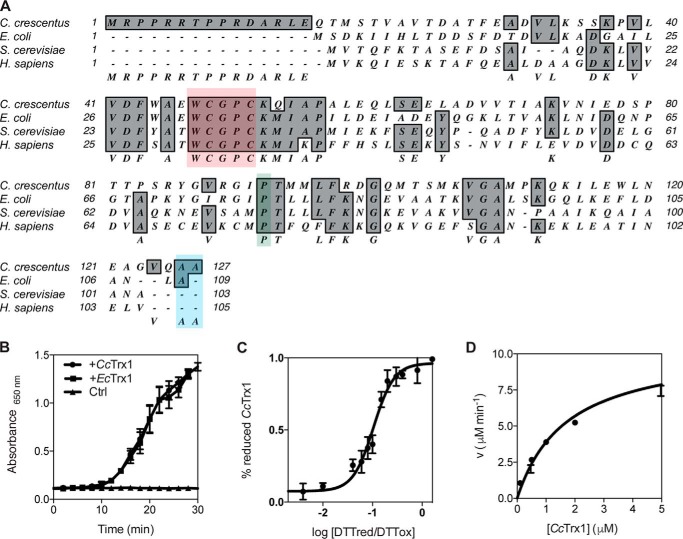
Figure 2.
CcTrx1 exhibits the biochemical properties of a classical Trx. A, alignment of CcTrx1 with well studied Trxs from E. coli (NP_418228.2), S. cerevisiae (P22217), and H. sapiens (P10599.3) using MacVector 12.0.1. The catalytic WCGPC motif is highlighted in red, the cis-proline is in green, and the two C-terminal alanines are in blue. B, CcTrx1 catalyzes the reduction of insulin by DTT as measured by following the increase in absorbance at 650 nm. EcTrx1 was used as a positive control, and a sample without any Trx (Ctrl) was used as a negative control. This graph shows the mean of three independent experiments, and the error bars represent the S.E. C, the redox potential of CcTrx1 is −275 mV. It was determined by equilibrating the protein in redox buffers containing different DTTred/DTTox ratios. The redox potential was calculated from the ratio between the amounts of oxidized and reduced CcTrx1 present at equilibrium and determined using AMS trapping experiments. The data shown are the mean ± S.E. of three independent experiments. D, the Km of CcTrxR for CcTrx1 is 1.71 μm. The reduction of CcTrx1 by CcTrxR was monitored by measuring the decrease in absorbance at 340 nm, corresponding to the decrease in reduced NADPH (the experimental conditions are described under “Experimental procedures”). We measured the initial velocities (v) of CcTrx1 reduction by CcTrxR to determine the kinetic parameters of the reaction. This plot shows the mean ± S.E. of three independent experiments and a fit of the data to the Michaelis-Menten equation.

