Figure 4.
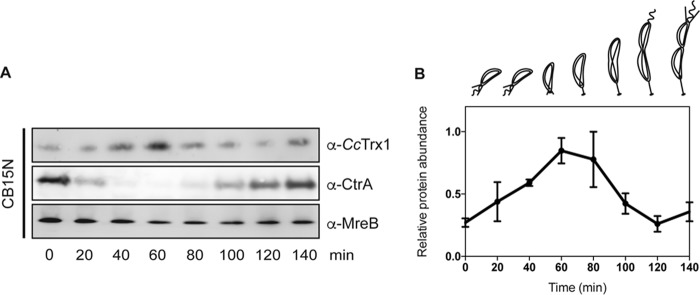
CcTrx1 is cell cycle–regulated. A, a WT cell (CB15N) culture was synchronized, and samples were withdrawn every 20 min. Immunoblotting detection shows the levels of CcTrx1 over the cell cycle. MreB is used as a loading control, and CtrA serves as a synchrony control. This experiment was performed in triplicate, and this panel shows representative results. The additional experiments are presented in Fig. S3. B, quantification of the levels of CcTrx1. Bands were detected by immunoblotting and quantified using ImageJ. This graph shows the mean of three independent experiments. Error bars represent S.E.

