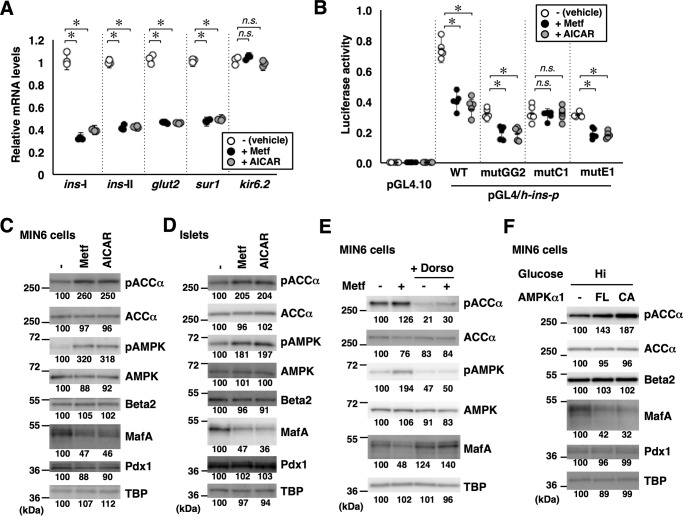
Figure 2.
AMPK negatively regulates MafA and the insulin promoter. A, total RNA isolated from MIN6 cells treated with the AMPK-activating reagents metformin (Metf, 500 μm) or AICAR (200 μm) under high-glucose conditions for 16 h were analyzed by quantitative RT-PCR using specific primers. Data are mean ± S.E. of three independent experiments. *, p < 0.05; n.s., not significant (Student's t test). B, luciferase assay. MIN6 cells were transfected with the insulin promoter reporter constructs used in Fig. 1, A and B (0.5 μg) and pEF-Rluc (0.5 μg). The cells were then treated with metformin (500 μm) or AICAR (200 μm) under high-glucose conditions for 16 h. Luciferase activities are presented relative to that of the pGL4/h-ins-p (WT) vector under high-glucose conditions. Data are mean ± S.E. of five independent experiments. *, p < 0.05; n.s., not significant (Student's t test). C and D, whole-cell extracts obtained from MIN6 cells (C) or primary mouse islets (D) grown in high-glucose medium containing metformin (500 μm) or AICAR (200 μm) for 16 h were analyzed by immunoblotting using the indicated antibodies. E, MIN6 cells grown in high-glucose medium were treated with metformin (500 μm) with or without the AMPK inhibitor dorsomorphin (Dorso, 10 μm) for 16 h. Cell extracts were then subjected to immunoblot analysis. F, expression plasmids for the FL or CA forms of AMPKα1 were transfected into MIN6 cells grown under high-glucose (Hi, 20 mm) conditions, and the cell extracts were analyzed by immunoblotting. The data in C–F are representative of two independent biological experiments. The intensity of the bands was quantified using ImageJ software, and the relative amounts (averages of two independent experiments) are indicated below the bands.

