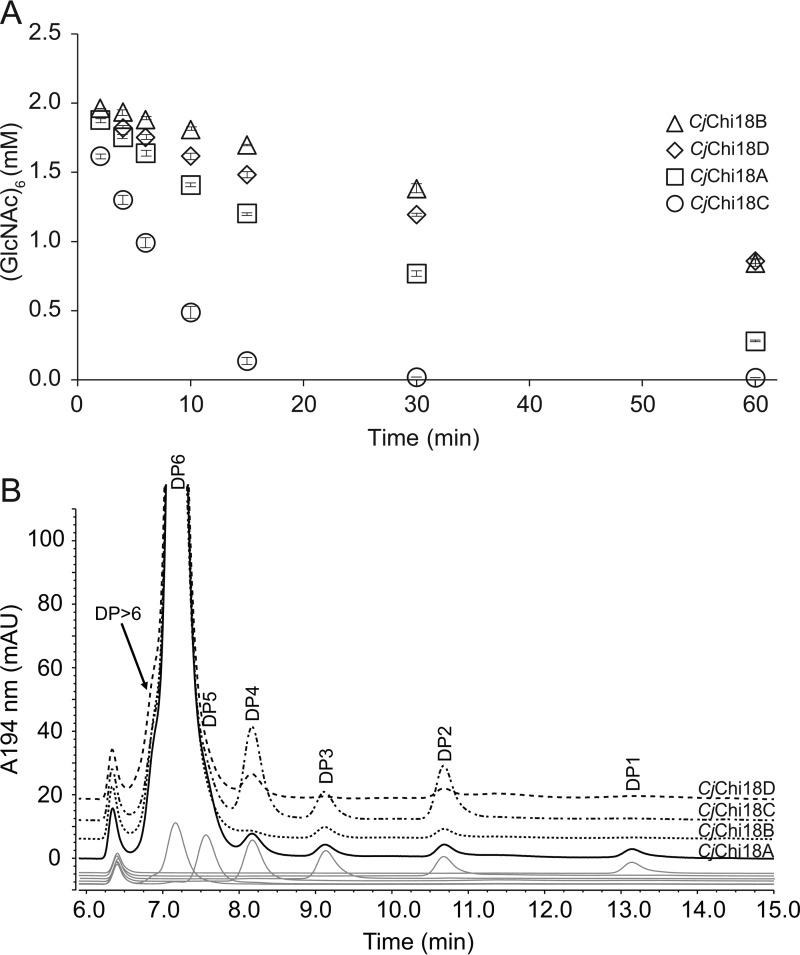
Figure 7.
Hydrolysis of (GlcNAc)6. A, hydrolysis of (GlcNAc)6 over time. The slopes of the linear parts of these curves were used to calculate the initial rates. Standard deviations are shown as error bars. B, chromatograms showing the product profile obtained 2 min after mixing chitinases with substrate. DP1–DP6 represent (GlcNAc)1–6. Chromatograms for various standards are shown as gray lines at the bottom. These experiments were done with the catalytic domains of the chitinases. The reactions contained 2 mm (GlcNAc)6, 10 mm BisTris, pH 6.5, 0.1 mg/ml BSA, and 50 nm enzyme and were done in triplicate at 30 °C. Chromatograms for samples taken after 60 min are shown in Fig. S4.

