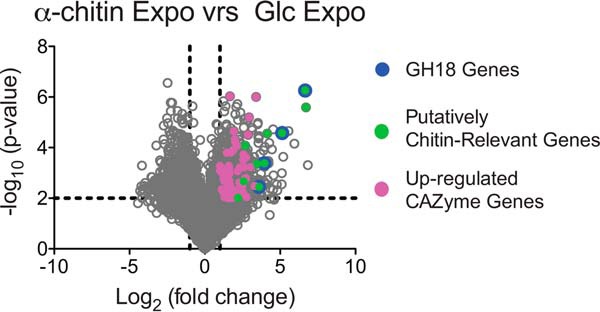
Figure 8.

Differential gene expression for C. japonicus during exponential growth. This volcano plot shows the log2(fold change) plotted against the −log10(p value) for every gene in C. japonicus during exponential growth on glucose compared with α-chitin, where each gray circle represents the expression of a single gene. The black dashed lines indicate the significance cutoff values: −log10(p value) > 2 and log2(fold change)> 1. The genes colored magenta represent CAZyme genes, and the complete list of these genes can be found in Table S3A.
