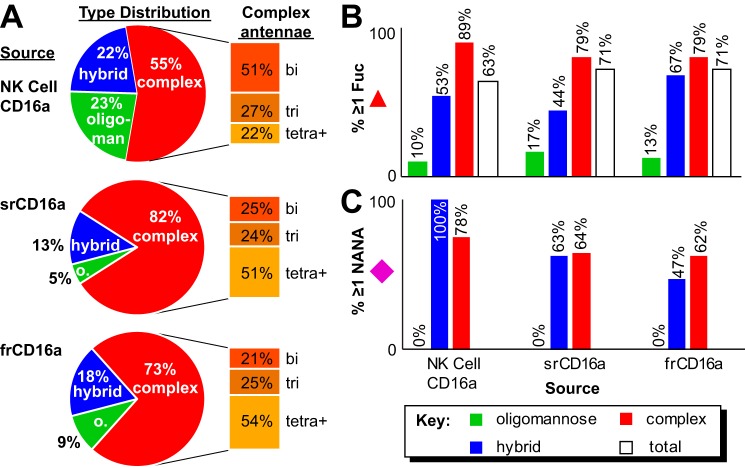
Figure 5.
Comparison of CD16a N-glycan characteristics from different sources. A, pie charts indicate what percentage of identified N-glycans fall into each of the three categories; extracted bar graphs show the breakdown of branching types for the complex-type N-glycans only. B, percentage of each N-glycan species that contained at least one fucose residue. C, percentage of each N-glycan species that contained at least one N-acetylneuraminic acid residue.

