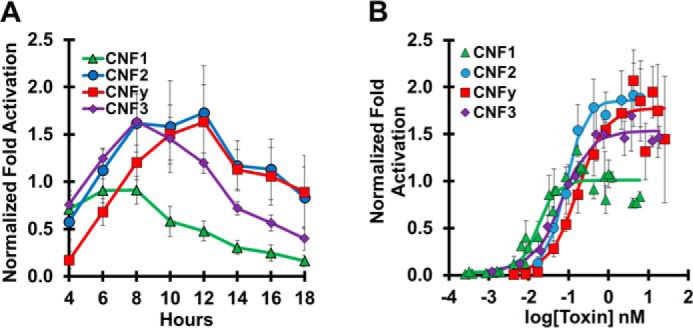
Figure 2.

Time course and dose response of wildtype CNF toxins. HEK293-T cells with reporter plasmids were treated with the indicated toxins and subjected to SRE-luciferase assay as described under “Experimental procedures”. Each experiment was performed in triplicate. Normalization of -fold activation is to the maximum activation of CNF1 as determined by the 4PL equation for each experiment. Data points shown are the mean values for that specified time or dose. Error bars represent the S.D. Corresponding scatter plots of all data points used to derive the best fit lines and mean values are shown in Fig. S3. A, time course of cells treated with 0.85 nm toxin (CNF1, green triangles; CNF2, blue circles; CNF3, purple diamonds; CNFy, red squares) for the indicated times before analysis by SRE-luciferase assay. Data shown are the mean ± S.D. of all points from four independent experiments for CNF1, CNF2, and CNFy and from two independent experiments for CNF3. B, dose-response curve for cells treated for 6 h with the indicated toxins at the indicated doses before analysis by SRE-luciferase assay. Data shown are the mean ± S.D. from three independent experiments.
