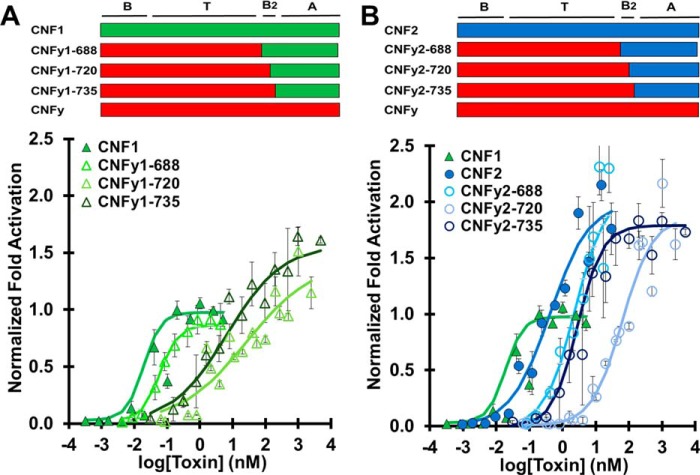
Figure 4.
CNFy delivery vehicle does not efficiently deliver heterologous cargos. HEK293-T cells with reporter plasmids were treated with the indicated toxin at the indicated doses and subjected to SRE-luciferase assay to determine the normalized -fold activation relative to CNF1 and untreated cells as described in Fig. 3. Data points shown are the mean values for that specified dose. Error bars represent the S.D. Corresponding scatter plots of all data points used to derive the best fit lines and mean values are shown in Fig. S6. A, dose-response curve comparing CNF1 cargo delivered by CNFy delivery vehicle (CNF1, green closed triangles; CNFy1-688, lime green open triangles; CNFy1-720, pale green open triangles; CNFy1-735, dark green open triangles). B, dose-response curve comparing CNF2 cargo delivered by CNFy delivery vehicle (CNF1, green closed triangles; CNF2, blue closed circles; CNFy2-688, electric blue open circles; CNFy2-720, pale blue open circles; CNFy2-735, dark blue open circles).

