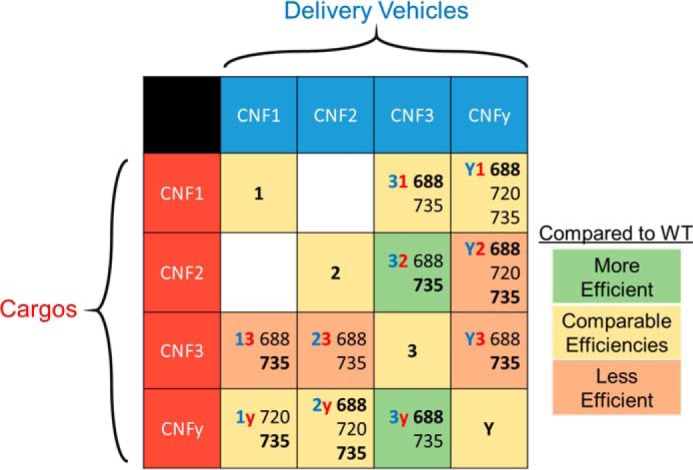
Figure 6.

Table of CNF results. Black numbers indicate the amino acid joining-site residues for the chimeras; the joining site that is most efficient for that chimera is bold. The shade of the cell indicates how the ratio of EC50 value of the best chimera of that type compares with the native CNF toxin with the same cargo as shown in Table 1. Cutoffs are as follows: Less Efficient > 4 > Comparable Efficiencies > 0.4 > More Efficient.
