
Figure 3.
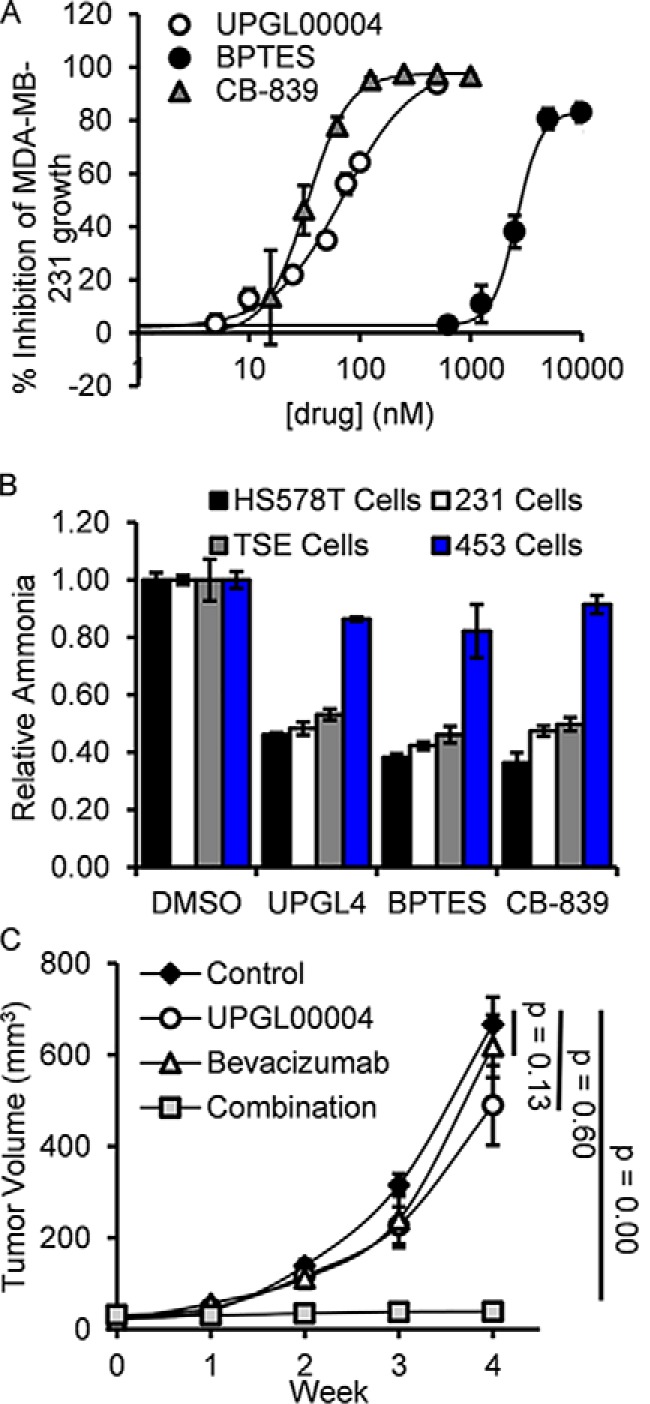
Comparison of the effects of UPGL00004, BPTES, and CB-839 on the growth of breast cancer cells. A, BPTES, CB-839, and UPGL00004 were added to MDA-MB-231 cells in the indicated amounts and their effects on cell proliferation were assayed. B, HS578T, MDA-MB-231, TSE, and MDA-MB-453 cells were treated in serum-free media for 14 h with BPTES, CB-839, or UPGL00004 (UPGL4). The media was then collected, and the amount of ammonia generated was determined for each sample. Error bars for panels A and B represent the mean ± S.D. of three independent experiments. C, plots showing mean tumor volumes (mm3) as a function of time for mice containing triple-negative HCI-002 grafts, which were treated with the different drug combinations. When tumors reached ∼3 mm in diameter, IP injections with vehicle alone (control) (black diamonds), bevacizumab (2.5 mg/kg weight of the animal) (white triangles), UPGL00004 (1 mg/kg weight of the animal) (white circles), or the two drugs together (gray squares), were injected every other day for 4 weeks. The tumor volumes for the bevacizumab plus UPGL00004 (n = 6), versus treatment with bevacizumab (n = 6), UPGL00004 (n = 6), or DMSO alone, were statistically significant. Error bars represent the S.E. for this experiment.