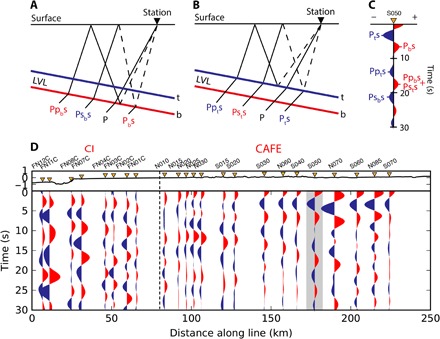
Fig. 2. Offshore (CI) and onshore (CAFE) receiver functions and LVL signature in northern Cascadia.

Onshore data show the signature of an LVL as dipping negative-positive–converted (Ps) and reverberated (Pps and Pss) pulses from (A) the bottom (b) and (B) the top (t) of the LVL shown here for station S050 (C) and for each station across the linear profile (D). Vertical dashed line indicates the coastline. Offshore signals are more difficult to interpret. Gray-shaded area in (D) around station S050 highlights the signal shown in (C).
