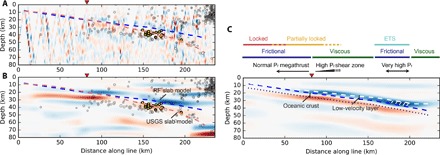
Fig. 3. Receiver function images from CCP stacking of converted Ps and back-scattered Pps and Pss phases projected along the linear profile.

(A) Weighted sum and (B) Gaussian- and phase-weighted sum of the Ps, Pps, and Pss CCP phase stacks. Yellow and gray circles indicate low-frequency and regular seismicity, respectively. Receiver function (RF) and U.S. Geological Survey (USGS) slab models are taken from refs. (12) and (20). (C) Same as (B) for synthetic data calculated for a model that incorporates an LVL (vp/vs, ~2) with thickness increasing from 2 km at the coastline to >5 km near the intersection with the mantle wedge corner (fig. S4 and section S1, model 8). Higher vp/vs (~3.5) near the source of LFEs [white-dashed area in (C)] suggests locally increased Pf. (C) also illustrates the approximate boundaries in 70 and 20% plate coupling (3), the episodic tremor and slip (ETS) region, and static strength regimes (27). These transitions correspond with the changes in fluid pressure (Pf) and shear-zone thickness across the coastline (red inverted triangle). Down dip of the viscous zone, locally increased Pf leads to embrittlement, where ETS occurs.
