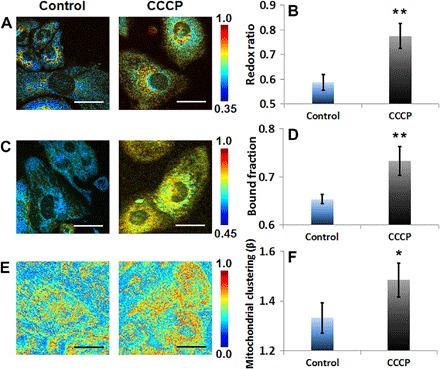
Fig. 3. Optical readouts of HL-1 cardiomyocytes in response to chemical uncoupling by CCCP.

(A) Representative maps of redox ratio. (B) Means and SDs of redox ratio. (C) Representative maps of bound NADH fraction. (D) Means and SDs of bound NADH fraction. (E) Representative images of clone-stamped mitochondria. (F) Means and SDs of mitochondrial clustering. The significance symbols on top of CCCP bars reveal significant differences compared with the control group. n = 4 cultures per group. Scale bars, 30 μm. *P < 0.05, **P < 0.01.
