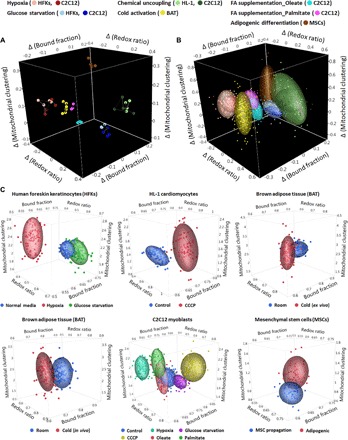
Fig. 6. Holistic visualization of data sets by combining all three optical metrics.

(A) A combination of relative changes of the redox ratio, NADH-bound fraction, and mitochondrial clustering metrics at the biological replicate level distinguishes all the metabolic perturbations. Colors used for representation of the different perturbations and biological specimens are shown on top. For each of the perturbations where data from multiple cell lines are shown, light and dark hues are used to differentiate between biological specimens. (B) A combination of relative changes of these three metrics at the cell level yields an original classification accuracy of 91.6% and a cross-validated classification accuracy of 91.6% in differentiating these metabolic perturbations. Ellipsoids represent 70% of data coverage. Color representation is the same as in (A). (C) 3D scatterplots based on single-cell analysis for visualization of heterogeneity across individual cells in different biological systems. The colors used for different experimental groups are indicated below each panel.
