
Fig. 3.
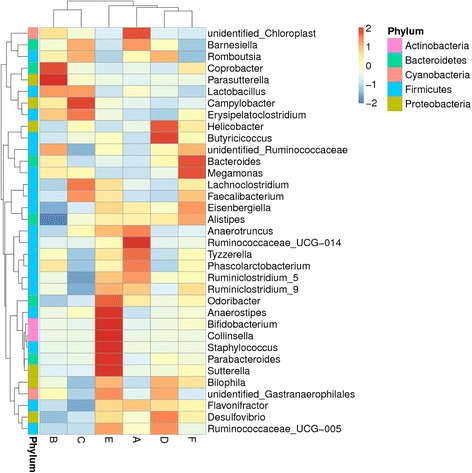
Hierarchically clustered heatmap analysis of the highly represented bacterial taxa (at the genus level) found in the cecal digesta communities of 23-day-old broiler chickens. The relative percentages (%) of the bacterial genus are indicated by varying color intensities according to the legend at the top of the figure. Bacterial genus names are listed on the right side of the heatmap, and the phylum names are listed on the left. Dendrograms at the top and left of the map indicate the phylogenetic relationship between the treatments and genus; the intensity of the cell color represents the abundance of the amplicons belonging to each genus. (a): the control; (b): Enzyme A (1,500 U/g α-amylase; (c): Enzyme B (Enzyme A + 300 U/g amylopectase + 20,000 U/g glucoamylase); (d): Enzyme C (Enzyme B+ 10,000 U/g protease); (e): Enzyme D (Enzyme C + 15,000 U/g xylanase); (f): Enzyme E (Enzyme D + 200 U/g cellulase + 1,000 U/g pectinase)