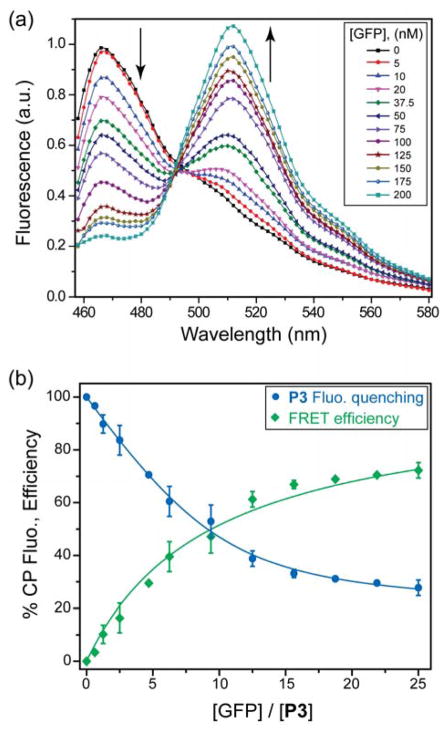
Figure 2. FRET between CPs and GFP.
(a) Emission spectra as a function of GFP concentration for the P3-GFP pair. [P3] = 8 nM; 5 mM sodium phosphate buffer. (b) Quenching of P3 fluorescence (blue circles) and the corresponding FRET efficiency (green squares) as a function of the increasing GFP concentration. Each value is the average of three independent measurements and the error bars are the ± standard deviations (SD). Solid lines represent the best-fitted curves, where the blue line is obtained from fitting the binding equation based on the model of single set of identical binding sites and the green line is obtained through fitting the Förster equation (See SI).

