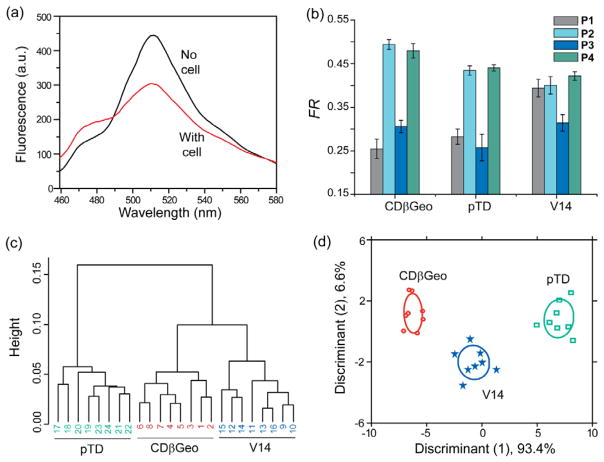
Figure 3. Detection of isogenic murine cells at different states.
(a) Initial fluorescence spectrum (red) of the P2-GFP complex and final spectrum upon incubation with CDβGeo cells. (b) Change in FRET responses (FR) from the CP-GFP complexes upon interacting with the isogenic murine breast cell types, where each value is the average of eight independent measurements and the error bars are the ± SD. (c) Clustering analysis of the FRET responses. Hierarchical clustering was performed on the raw data set (3 cell lines × 8 replicates × 4 CP-GFP complexes) using a correlation metric and average linkage. (d) LDA score plot of the FRET responses. The analysis resulted in canonical scores with two discriminants explaining 93.4%, and 6.6% of total variance and was plotted with 95% confidence ellipses around the centroid of each group.

