
Figure 5.
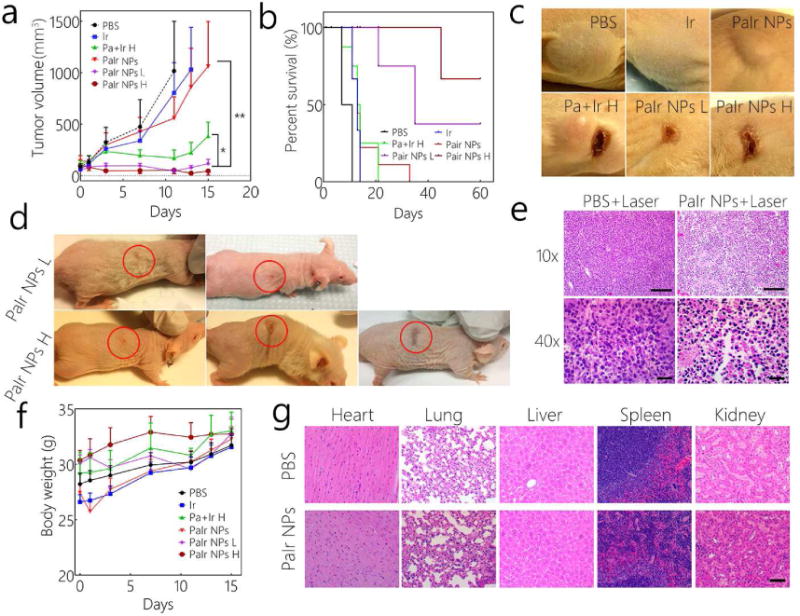
a) Tumor volumes and b) Kaplan–Meier curves for PDX GBM bearing mice (n=6). c) Tumors images of each group after 2 doses treatments. d) The images of completely cured mice. The red circles denote the treated tumor region that after the laser burned scars naturally fell off. e) Histopathological evaluation of PBS or PaIr NPs treated tumors (with 0.8 w/cm2 laser treatment). The scale bar in 10 × images is 200 μm, and in 40 × is 60 μm. f) Body weight changes of the PDX GBM-bearing mice (n=6). g) H&E staining of main organs of PaIr NPs treated mice, PBS-treated group was set as control. The scale bar was 100 μm. The light dose was 0.8 w/cm2. Ir dose: 20 mg/kg, PaIr NPs dose: total 40 mg/kg (Pa 20 mg/kg & Ir 20 mg/kg), and Pa+Ir dose: 20 mg/kg Pa mixed with 20 mg/kg Ir. High laser power was 0.8 w/cm2, and low laser dose was 0.4 w/cm2. All laser treatments lasted for 3 min.