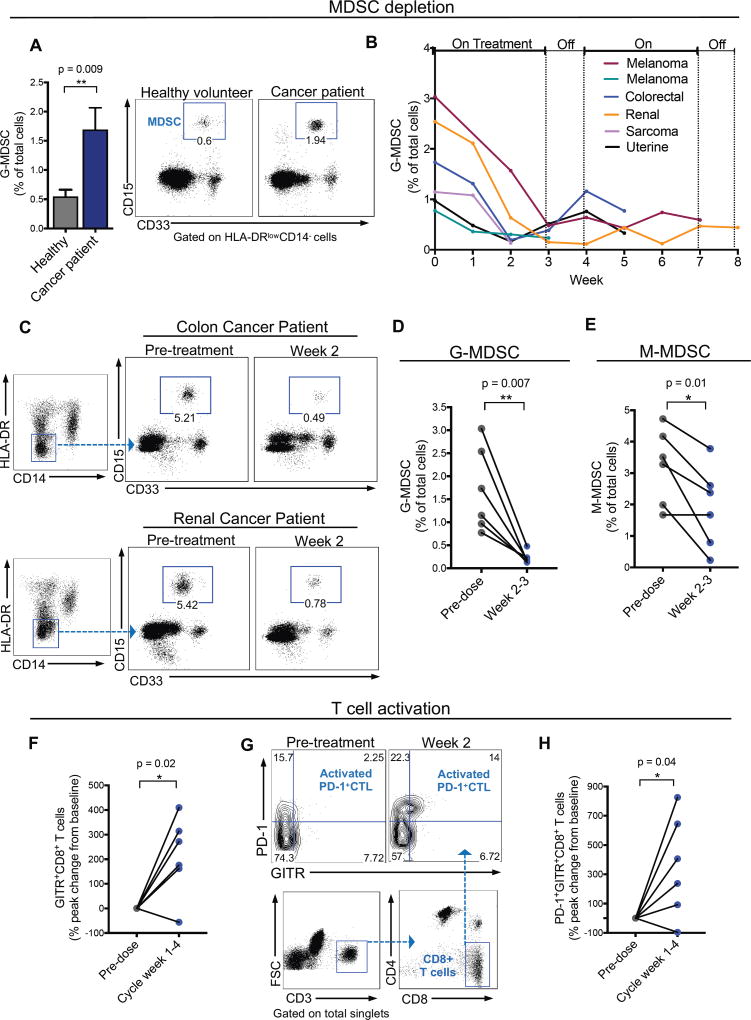
Figure 7. RGX-104 depletes MDSCs and activates CD8+ T cells in human cancer patients.
(A) Percent of granulocytic MDSCs (G-MDSC) of total circulating cells in the peripheral blood of cancer patients relative to healthy volunteers (n ≥ 6). Representative plots demonstrating the G-MDSC population in healthy volunteers compared to cancer patients.
(B) Percent of G-MDSCs of total circulating cells measured weekly from six patients treated with two 28-day cycles of RGX-104 (administered once daily for three weeks, then off for one week) – week 0 corresponds immediately prior to treatment initiation. For some patients, data is not available for the entire two cycles due to lack of blood samples or treatment termination (n = 6).
(C) Representative plots demonstrating the G-MDSC population in a colorectal cancer patient (top) and a renal cancer patient (bottom) treated with RGX-104 at week 0 (pre-treatment) compared with 2 weeks after therapy initiation.
(D–E) Percent G-MDSCs (D) and M-MDSC (E) of total circulating cells in 6 patients treated with RGX-104 at week 0 compared to weeks 2–3 on therapy (n = 6).
(F) Percent peak change in CD8+ T cells that express GITR of total CD8+ T cells in the circulation of patients treated with RGX-104 at week 0 compared to weeks 1–4 of the therapy cycle (n = 6).
(G) Representative plot showing the population of PD-1+GITR+ double-positive CD8+ T cells (activated PD-1+ CTLs) in the circulation of a patient treated with RGX-104 at week 0 (pre-treatment) and at week 2 of therapy.
(H) Percent peak change in CD8+ T cells that are double positive for PD-1+GITR+ in the circulation of patients treated with RGX-104 at week 0 compared to weeks 1–4 of the therapy cycle (n = 6).
Data represent mean ± s.e.m. See also Figure S6.

