
Figure 3.
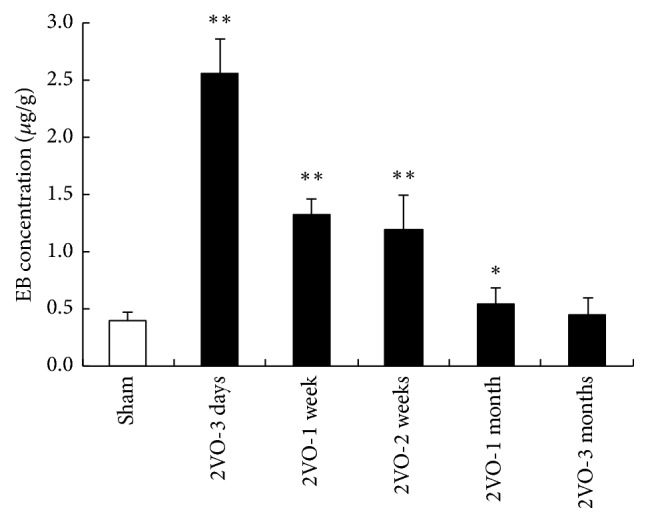
Effect of CCH on EB extravasations. Analysis of the cerebral concentration of EB. The amount of EB extravasation was increased to get the maximal point at 3 days after 2VO. And then the EB extravasation began to decrease compared with that of the 3 days. In 3-month group, the EB concentration was slightly higher than that of control group (∗p < 0.05, ∗∗p < 0.01, compared with the brain of sham control animals; n = 5 in each group).