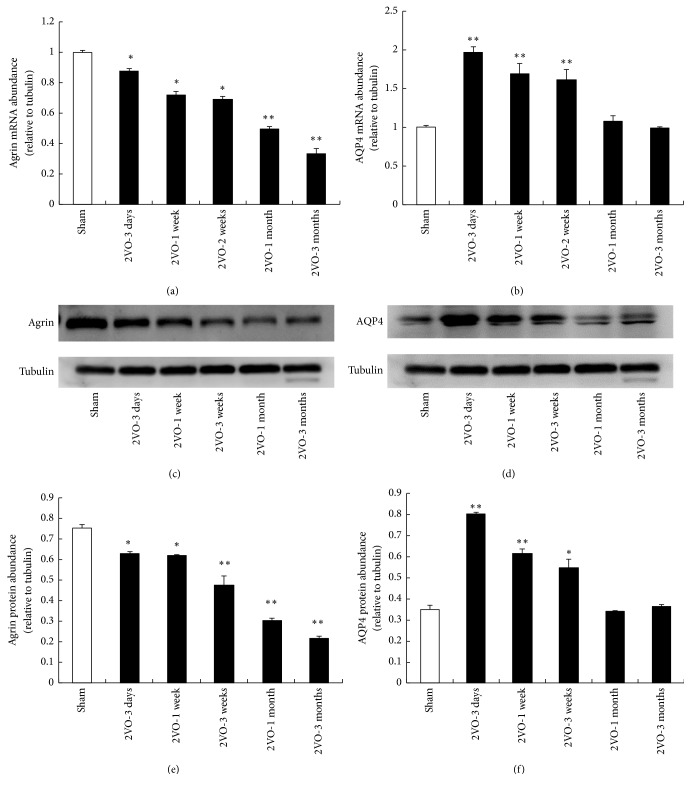
Figure 4.
The mRNA or protein level of agrin and AQP4 after 2VO. (a) The representative picture revealed the decrease of agrin mRNA after 2VO. (b) The changing trend of AQP4 mRNA expression was bidirectional. ((c) and (d)) Representative immunoblot of agrin and AQP4. ((e) and (f)) Quantification of agrin and AQP4 protein expression. (∗p < 0.05 and ∗∗p < 0.01, compared with the brain of sham animals; n = 5 in each group).

