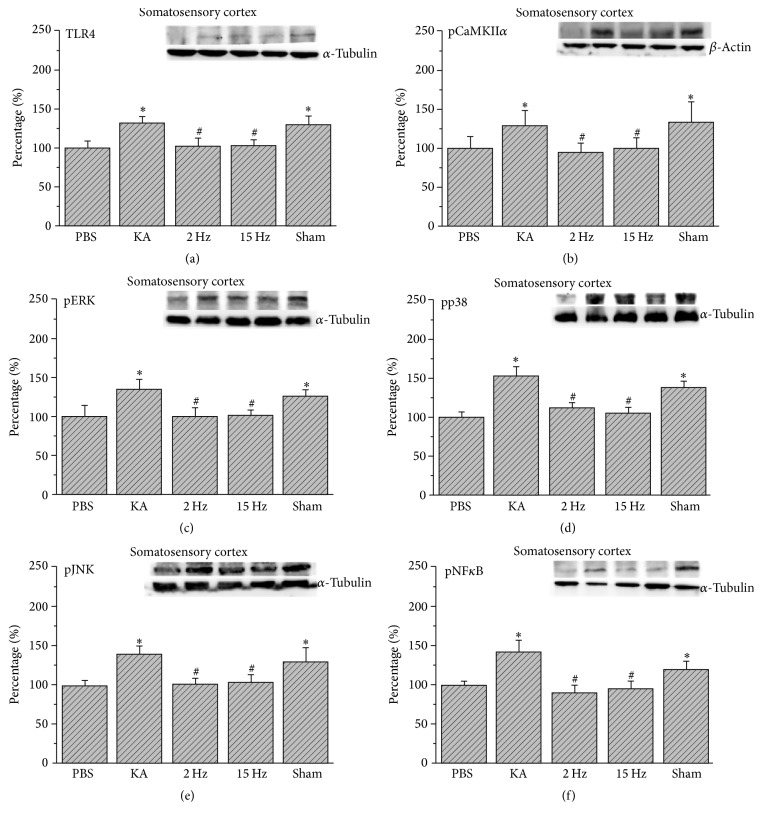
Figure 3.
Expression levels of TLR4 and related molecular proteins in the somatosensory cortex. (a) TLR4, (b) pCaMKIIα, (c) pERK, (d) pp38, (e) pJNK, and (f) pNFκB expression levels in the somatosensory cortex of the PBS, KA, 2 Hz, 15 Hz, and sham ES groups (from left to right). PBS = phosphate-buffered saline; KA = kainic acid-induced epileptic rats; 2 Hz ES = 2 Hz electrical stimulation of the ear; 15 Hz ES = 15 Hz electrical stimulation of the ear; sham = sham-operated electrical stimulation of the ear. ∗p < 0.05 compared with the control group. #p < 0.05 compared with the KA group. The western blot bands at the top indicate the target protein. The lower bands correspond to the internal controls (β-actin or α-tubulin).

