
Figure 1.
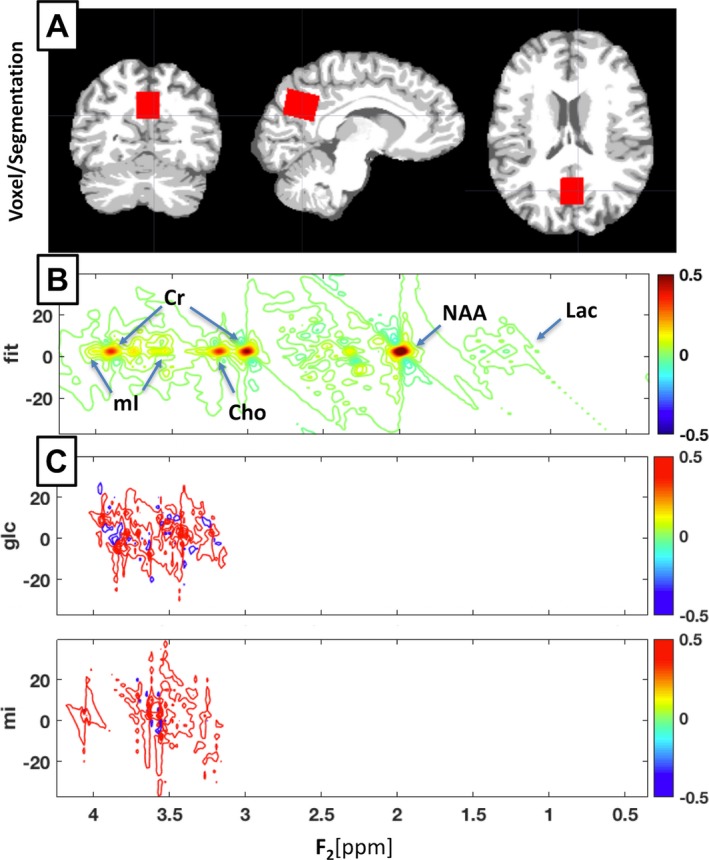
Segmentation & J‐PRESS Acquisition. (A) Segmented coronal, sagittal, and axial views of a representative younger control participant, showing bilateral precuneus voxel placement in red. Segmentation is displayed with white as white matter, light gray as gray matter, and dark gray as CSF. Figure created in MRIcroGL version 1.150909. (B) ProFit spectral fitting for a representative Alzheimer's disease participant showing labels for location of standard reference metabolite peaks (NAA, Cr, Cho) and mI. (C) ProFit basis sets used for J‐PRESS glucose and mI measurements showing the complex spectral location of these metabolites.